Making Bank Data Legible: Moving Beyond Another Dashboard
Data Intelligence turns a bank's or credit union's data into dashboards, reports and recommendations. It grew out of separate desktop-style apps, and people got lost in it: navigation was the top customer complaint, and it cost sales.
Before the redesign began, our Customer Advisory Board told us they had enough dashboards. They needed to know what to do next. So every page in the redesign points to a next step, and AI summaries are one of the ways it does. I led it by subtraction: fewer levels, fewer competing controls, and progressive disclosure.

Problem
People rarely got lost in the sidebar. They got lost after the first click. A user building a dashboard sat under seven levels of navigation, and the tabs, panels and accordions at each level looked nearly the same, so there was no way to tell whether a control changed the page, the view or a panel.
Navigation was the number one complaint from customers. It got bad enough that a developer hackathon project set out to improve search so people could get around the app at all.
More than once, I was told directly that we had lost sales over the product experience.
The complaint traced back to four deeper problems, and almost any page showed all of them.
No clear identity
It tried to be too much at once: a data product wrapped in a whole desktop of shortcuts, a taskbar and stacked windows. It never settled into one product with one clear purpose.
Built around the data, not the work
Screens followed the data's structure: seven levels on one page, tabs inside tabs and accordions inside accordions, so one job's steps were spread across several screens.
Everything at equal weight
Nothing used progressive disclosure. Every option and every button was on screen from the start, the one that mattered never stood out, and tooltips were left to do the explaining.
No sense of place
Screens looked alike and the breadcrumb doubled as navigation, so people could not tell where they were, how they got there or what a control would change.
But the real problem was never the screens. Product, engineering and leadership each wanted something different first, and the pull to add one more button never let up. At the end of the day, it was a people problem.
The reframe
Making data actionable
Before the redesign started, our Customer Advisory Board reframed it. Banks and credit unions already had plenty of dashboards and data. What they lacked was a clear next step.
So every page got one test: after reading it, does the person know what to do next?
Discovery, led by the product designer I directed, pointed the same way. The pattern was structural: people found the sidebar item they wanted, then lost their place inside the page.
Personas
The personas came from three kinds of research. Pendo usage data showed which roles used which parts of the product, and how often. 1:1 interviews showed how each role actually works. Pendo surveys and in-app feedback buttons told us where people got stuck.
Together they said the same thing: the people who use it are technical, short on time, and each role arrives with its own questions. So Home and the data are set by role, and Home opens on the questions that person's job asks.

Home asks: What should I offer this member?

Home asks: How is my branch tracking to goal?

Home asks: Which segments respond best to card offers?

Home asks: How did deposits move this quarter?
Solution
Solving it by subtraction
The goal: anyone finds any feature without training, and new features never add levels. Three principles carry it.
01
Depth is a budget
Every screen fits Section, Page, one view switcher, then content
One row of tabs at most. Anything deeper becomes a page, a mode or a panel section.
02
One look per job
A control's look says what it does
Sidebar items go to pages, tabs switch views, toggles switch modes, chips filter. No two look alike.
03
AI does the legwork
Answers arrive before you ask for them
The AI already knows the page you are on, so it says what changed and suggests the next question with no prompt to write. Any change it proposes still waits for a yes.
Data visualization
Charts follow the same rules
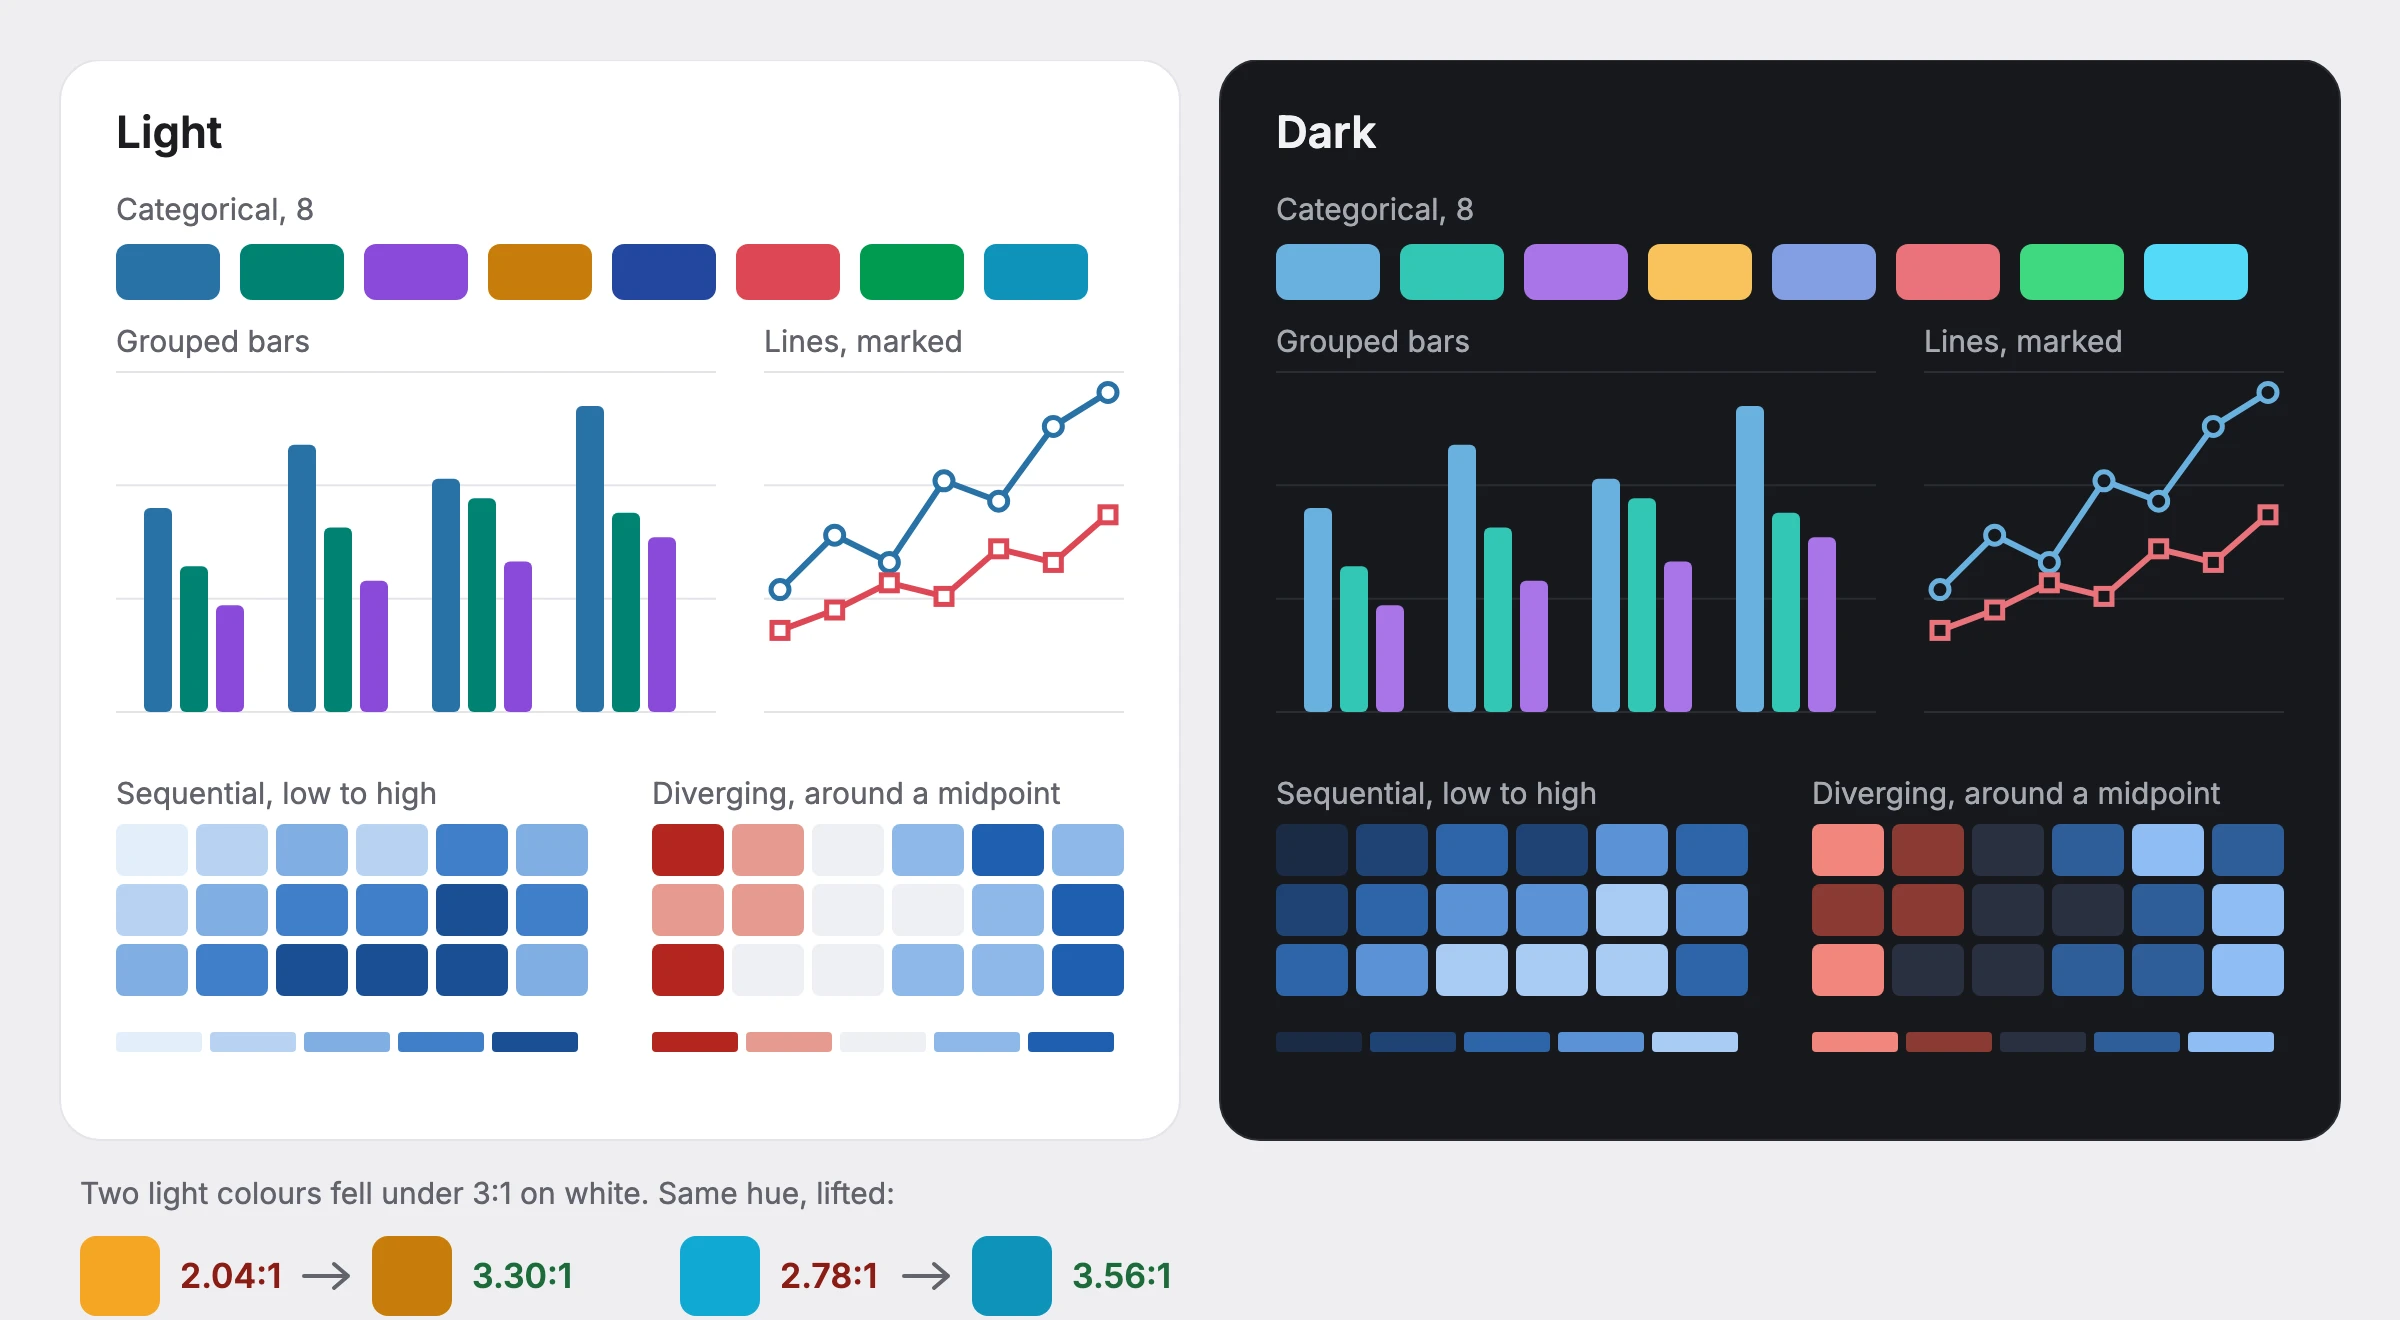
Most of what people open in Data Intelligence is a chart, so charts got the same treatment as every control. Colours, type and gridlines come from Prism's tokens in both themes, whichever chart engine draws them, and a chart stores only the name of its palette, so a theme switch never leaves it in the wrong colours.
Every mark has to reach 3:1 against the surface under it. Two of Prism's chart colours didn't on white, at 2.04:1 and 2.78:1, so I lifted them to 3.30:1 and 3.56:1 without changing the hue, and a test now checks every palette in both themes. Heatmaps get a five-step scale from low to high, and values either side of a midpoint get a diverging one.
Colour is never the only signal. Lines carry marker shapes, patterns are available wherever colour alone separates series, every chart can be stepped through by keyboard with a written summary, and an empty chart says its filters returned nothing and offers to clear them, instead of showing an error.
Leadership
Leading the team
One product designer worked on this with me. They led discovery and much of the screen-level work. I set the direction and held the bar, and I spent most of my effort helping them grow into the parts of the job that aren't drawing screens.
A steady rhythm
Weekly 1:1s on the work and on their growth, design critiques where I pushed on the reasoning behind each choice, and pairing in Figma on the hardest screens.
Holding the design through scope cuts
When scope was cut, we worked through it together: what the design had to keep to still solve the problem, what could wait for a later phase, and how to make that case to product and engineering.
Taking the noise
I took stakeholder pushback myself, set the release order from usage data so they could design one phase at a time, and owned the design system work so they could stay on the flows.
Where they are now
They started out losing parts of a design whenever scope moved. Now they negotiate scope themselves and keep the design whole, which was the part of the job I most wanted them to own.
Phases
Phase strategy
The redesign ships in the order the usage data set: what reaches the most people goes first, and the tools a few people use all day come last.
How the work moves
Each phase runs through our stage-gated product process. At every gate, people click through a working prototype I built with AI from my own PRD, not slides.
Phase 1 · 2026Shipped
The way in
- The first of the new navigation: the drawer
- Homepage and search
- Ask AI
What every user sees first. The landing page and dashboards reach the most people, so the way in goes first, and the new navigation starts with it.
Phase 2In progress
Where most people work
- The bulk of the navigation
- Dashboards and the library
- Folders
- Reports
The bulk of the navigation work lands here, across the pages with the widest reach after the landing page, on the templates the frame set up.
Phase 3
Power tools
- The rest of the navigation
- Tables
- Queries
- Dashboard and dataset builders
The navigation finishes in the deepest tools. Fewer people use them, for much longer, so they come last and get the most care.
Feedback
Feedback and reception
Customers have been part of this from the start, and their response has shaped it as much as it has judged it.
A feedback loop built into the work
Feedback runs through every phase, not just the end of it: 1:1 sessions and demos with customers, user testing on the prototype, Pendo surveys and in-app feedback buttons, and usage data on what people actually open. Each later phase goes through that loop before it is built.
It has already paid off. What customers told us changed parts of Phase 1 before it shipped, and the same loop is shaping Phase 2 now.
A lot better and more polished. You can let the team know that it is a big improvement from the last few weeks.
On the redesign as it stands today





Start the conversation
Whatever you're working on, I'd like to hear about it.